Across the U.S., the rate of unemployed Americans increased more in three months during COVID-19 than it had in two years during the recession in 2007. In May 2020, more than 20.5 million Americans were out of work, many as a result of the pandemic and its impact on the U.S. economy.
As a result of these challenges, nearly 800,000 veterans were unemployed in 2020. And while the national unemployment rate in the U.S. was as high as 10.2% in July 2020, it was slightly higher (10.5%) among veterans.
With over 200,000 veterans reentering the private workforce each year, we utilized 2019 data from IPUMS.org to explore how pay and compensation for veterans compares to standard civilians; which states are the best for employed veterans; and how the gender pay gaps vary between veteran employees and those without military experience on their resumes. Read on to see what we discovered.
Assessing the Average Income in America
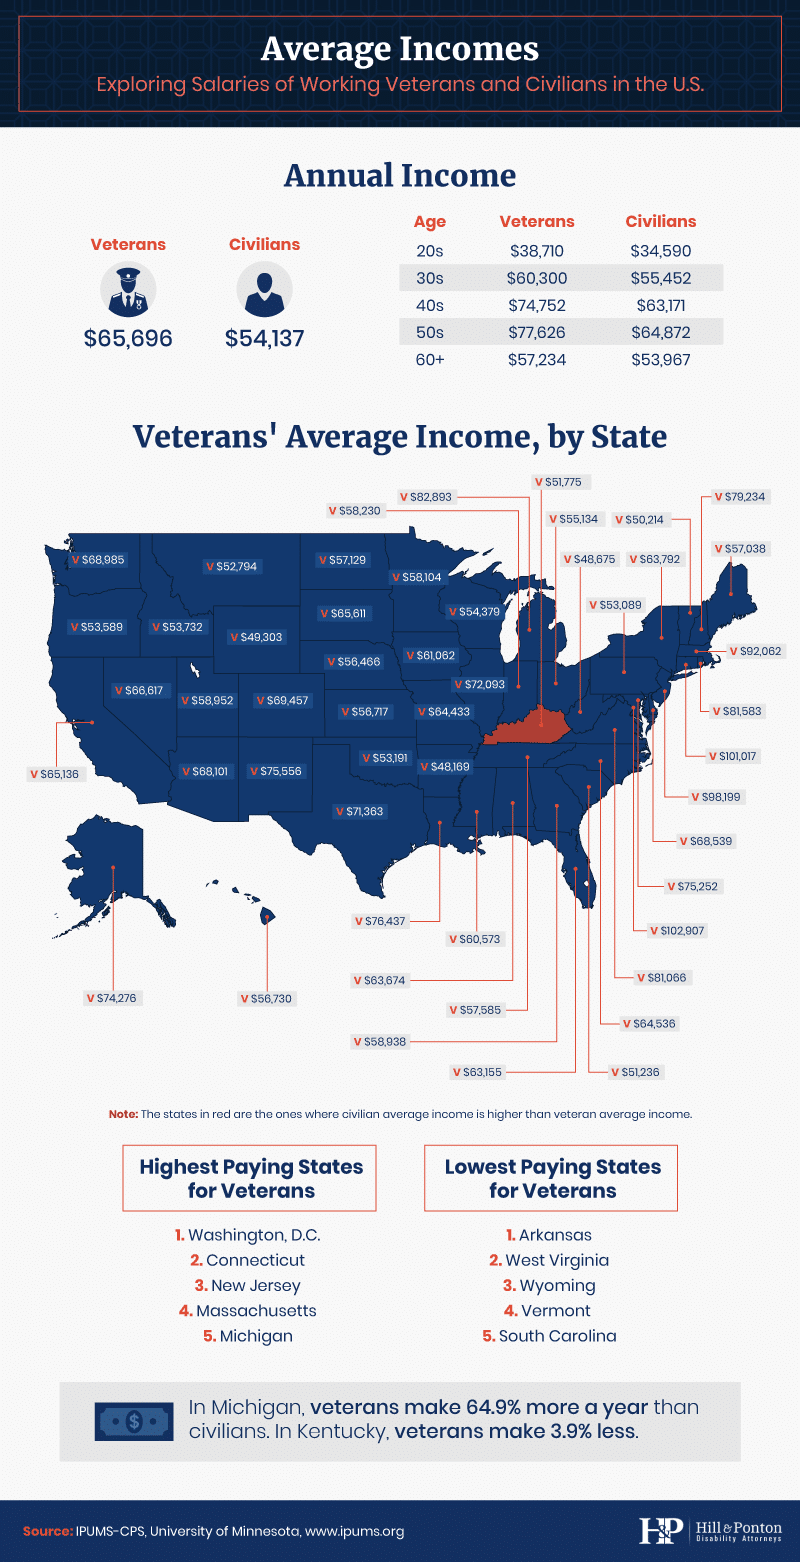
In 2019, the average American income was just over $54,000 among people without military service on their resume. In contrast, veterans earned over $11,000 more, averaging nearly $65,700. According to the IPUMS data, veterans in their 50s had the highest average salaries ($77,600), while veterans in their 20s comparatively earned the lowest salaries ($38,700).
Overall, the highest paying areas for veterans in 2019 included Washington, D.C. ($102,900), Connecticut ($101,000), New Jersey ($98,000), Massachusetts ($92,000), and Michigan ($82,900). In contrast, the lowest paying states for veterans were Arkansas ($48,200), West Virginia ($48,700), Wyoming ($49,000), Vermont ($50,200), and South Carolina ($51,200). Among the five states with the lowest average incomes for veterans in the U.S., there are currently no major military bases.
In Michigan, where there are both Coast Guard and Air Force bases, veterans earn 65% more, on average, compared to civilians. In Kentucky, veterans have the highest negative disparity in income, earning nearly 4% less than civilians, on average.
Veteran Unemployment in America
At the end of 2018, there were nearly 18 million veterans across the U.S., accounting for more than 7% of the adult population. Five million veterans had at least one disability, and another 1.2 million veterans in the U.S were living in poverty. Nearly 38,000 military veterans were homeless at the end of 2018.
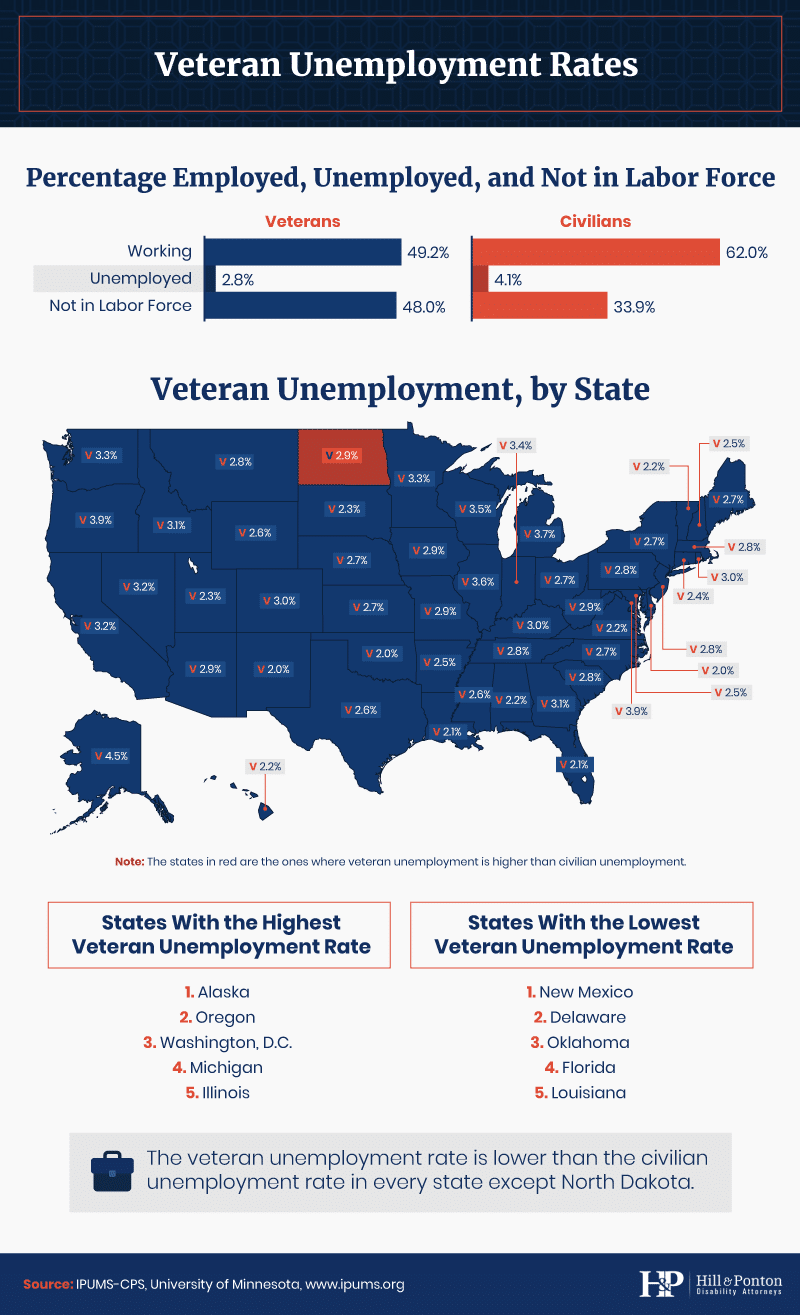
While 62% of nonservice members in the U.S. were working in 2019 and 34% were not currently in the labor force, veteran employment numbers were significantly different. Compared to 49% of veterans in 2019 who were currently working, 48% were not in the labor force, and close to 3% were unemployed.
Veteran unemployment was highest in Alaska (4.5%), Oregon (3.9%), Washington, D.C. (3.9%), Michigan (3.7%), and Illinois (3.6%). In 2019, the unemployment rate for veterans was lower than the civilian unemployment rate in every state except North Dakota. For service members leaving their existing orders or active duty altogether, the number of government programs available to help match them with employment opportunities are so readily available that they can sometimes be overwhelming for veterans entering the workforce.
Disparity in Job Compensation Between Veterans and Civilians
The highest paying positions for veterans include chief executive and legislator roles, averaging nearly $213,800 annually, 17% higher than civilian pay ($182,600) for the same role.
Veterans earned higher salaries for the same positions compared to civilians in real estate positions (56% higher), first-line supervisors of office and administrative employees (41% higher), computer support specialists (40% higher), and as property, real estate, and community association managers (39% higher). In contrast, their salaries were lower as judicial workers (including lawyers and judges) (19% lower), sales representatives (6% lower), and accountants and auditors (6% lower).
Changes in Veteran Income Since 2000

On average, veterans in the U.S. earn higher salaries than Americans without a record of service, but the average salary increase for veterans since 2000 has been dramatically different across the country. In 2000, the average veteran was earning just over $39,000, increasing over $26,000 to the average income of over $65,000 in 2019. By contrast, the average civilian income increased roughly $32,000, from $29,000 to nearly $53,000. Compared to these changes, active duty military compensation increased just 1.7% between 2011 and 2016, indicating a possible lag for military compensation, compared to the average American worker.
The highest average income increases from 2000 to 2019 for veterans occurred in New Mexico (60%), New Jersey (55%), Connecticut (45%), Massachusetts (41%), and Maine (39%). And while these increases were substantial, there were many states where the average income for veterans decreased between 2000 and 2019 instead. Overall, the greatest decreases were in Idaho (22%), Colorado (18%), Kentucky (16%), Oklahoma (14%), and Arkansas (13%).
The Gender Pay Gap for Veterans
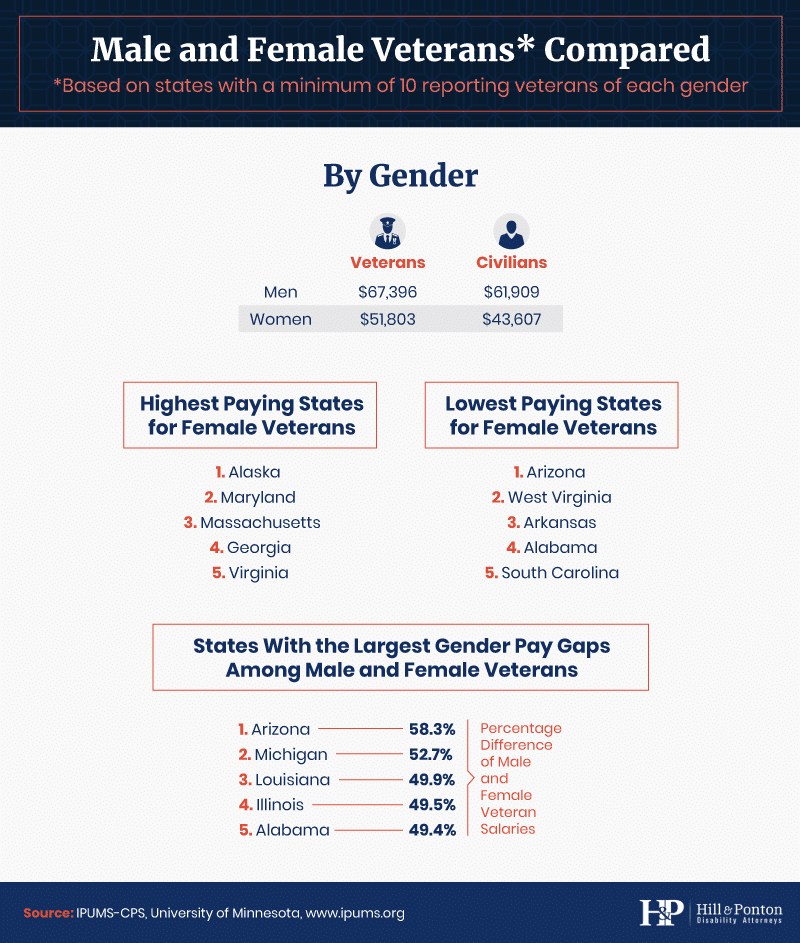
The gender pay gap in the U.S. economy is real (and possibly worsened by the COVID-19 pandemic), and those same disparities may also exist among employed veterans. In 2019, employed men with no record of service earned over $18,000 more than women without a record of service. Among veterans, men earned nearly $16,000 more than women.
For female veterans, the highest paying states in 2019 included Alaska, Maryland, Massachusetts, Georgia, and Virginia. In contrast, the gap between female and male veteran incomes was highest in Arizona (58%), Michigan (53%), Louisiana (50%), Illinois (50%), and Alabama (49%).
Protecting Our Veterans
At first glance, veterans earn more, on average, than Americans in the workforce without military service on their records. And while this trend has been persistent over the last decade, there are still some parts of the country where veterans earn significantly less than nonveterans with the same job titles and where the average income has decreased over the last decade rather than rise with the trend.
At Hill & Ponton, we’ve spent the last 30 years managing over 30,000 veteran claims and Social Security disability cases, recovering more than $300 million for our clients. With a focus on veterans law and Social Security legislation, we help veterans navigate life with disabilities, so they can focus on what really matters – their health. If your claim has been denied by the VA, let us help you fight back. Get a case evaluation today at HillandPonton.com.
Methodology and Limitations
We used the IPUMS Current Population Survey microdata to perform this research. You can read the full methodology and limitations of this data source here.
We used the 2019 ASEC sample for unemployment and salary information. For trends over time, we used the annual ASEC surveys.
When looking at average salaries and unemployment rates, each state had at least 30 reporting veterans in the dataset.
For income by occupation, we only considered occupations that had at least 25 civilians and 25 veterans reporting.
When comparing male and female veterans, only states with at least 10 veterans of each gender within the dataset for 2019 were considered in the comparisons.
All data is weighted using the ASECWT variable provided by IPUMS.
Fair Use Statement
Share these findings about veteran income with your followers for any noncommercial use by including a link back to this page in your story so they have full access to our findings and methodology.